Visualizing with Roassal
Roassal maps objects and connections to graphical elements and edges. Values and metrics are mapped to visual dimensions, such as the width, height, or the color intensity. Mapping objects to visual attributes is an expressive way to build flexible and rich visualizations, and easily define this mapping significantly reduce the effort to build a visualization. This chapter gives an overview of Roassal and its main API. It covers the essential concepts of Roassal, including the view, elements, shapes, and interactions.
1. View, Elements, Shapes and Interactions
Roassal structures a visualization in terms of views, elements, shapes, interactions, and animations. A view is a container of graphical elements. Elements can be added and removed from a view. Most visualization contains one single view that contains all the Roassal elements.
An element is a graphical representation of an object, typically describing an arbitrary domain (e.g., information about seism, a file stored on the hard disk, a tweet). An end-user sees elements and interacts with elements using the mouse and keyboard. An element is described by a shape that define its visual representation. A shape describes a primitive visual representation such as a box, a circle, a line or a label. Shapes may be combined to form elaborated shapes. A Roassal element is a compound object that contains (i) a two dimensional spatial location; (ii) a set of interactions; (iii) a combination of shapes; (iv) an object model, which is an arbitrary object that belongs to the domain model provided by the user. To be visible, elements must have at least one shape.
An interaction is a particular action the user may trigger. The range of supported interactions is broad: dragging elements, popping up an element when locating the mouse above, highlighting other elements, getting a menu by right-clicking on an element are all common interactions.
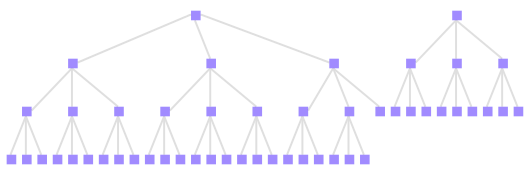
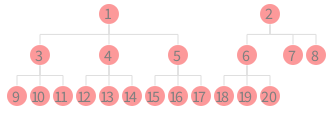
The following example renders a tree, where each node is a number (Figure 1.1):
	v := RTView new.
	shape := RTBox new color: Color blue trans.
	elements := shape elementsOn: (1 to: 50).
	v addAll: elements.
	elements @ RTPopup.

	RTEdgeBuilder new
		view: v;
		objects: (1 to: 50);
		connectFrom: [ :i | i // 3 ].

	RTTreeLayout on: elements.
	v
The first line creates a new view as an instance of the class RTView and assign it to the variable v.
A colored box shape is then created. The expression Color blue trans defines a transparent blue color.
The shape is then used as a factory of Roassal elements using the message elementsOn:. This message takes a collection of object model as argument, and returns a collection of RTElement. Each element has a numerical value, between 1 and 50 as object model. These elements are then added into the view v.
The expression @ RTPopup makes each element react when the mouse is above it: a popup is displayed that shows the model of the element, the number in our case.
The relations between the elements are then expressed using the class RTEdgeBuilder. An instance of RTEdgeBuilder is created and then parametrized with the view. This edge builder retrieves particular elements from the view and draws edges between two elements. The code specifies that for each number i between 1 and 50, an edge is drawn between i and i // 3. The message // refers to the integer quotient: 10 // 4 = 2.
You can know more about this message by writing // in a playground, selecting these two characters with the mouse, right-clicking and selecting "implementors of it". This opens a new window showing all the methods in the system named //. Comments contained in the code describe the purpose of the method.
2. Computing shapes dimensions
One key aspect of Roassal is that shapes may hold metrics or numerical values that define their visual dimensions (e.g., height, width, color, border width). A shape may take absolute numerical values (e.g., RTBox new width: 30; height: 40) or some metric definitions (e.g., RTBox new width: [ :cls | cls numberOfVariables ]; height: [ :cls | cls numberOfMethods ]).
The following code is a more elaborated example that extracts data from a Tab Separated Values (TSV) table (Figure 2.1):
	"Processing a small TSV table"
	tab := RTTabTable new input:
	'id	value1	value2	category	parent
	1	10	20	A	1
	2	5	12	B	1
	3	8	17	A	1
	4	9	13	D	3
	5	30	30	D	3'.
	tab removeFirstRow.
	"Converting columns into integer"
	tab convertColumnsAsInteger: #(1 2 3 5).

	v := RTView new.
	colorNormalizer := RTMultiLinearColorForIdentity new
				objects: (tab values collect: #fourth) asSet sorted;
				command: #fourth.
	shape := RTBox new
				width: #second;
				height: #third;
				color: colorNormalizer.
	elements := shape elementsOn: tab values.
	v addAll: elements.

	elements @ (RTPopup new text: [ :entry |
		'id = ', entry first asString, String cr,
		'value1 = ', entry second asString, String cr,
		'value2 = ', entry third asString, String cr ]).

	elements @ (RTLabeled new text: [ :entry | entry first ]).

	RTEdgeBuilder new
		view: v;
		objects: tab values;
		connectFrom: [ :entry | tab values at: entry fifth ].

	RTHorizontalTreeLayout new
		verticalGap: 30; on: elements.
	v
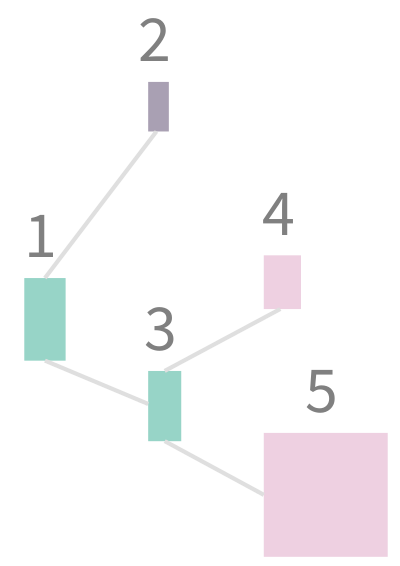
The script above extracts and visualizes data from a TSV table (any spreadsheet application generate documents in that format). In this example, we assume that each row contains a numerical identifier, two values, and the identifier of a parent table entry.
The class RTTabTable converts the textual description of the table (i.e., the raw file content) into actual values that are usable by Roassal. The first row of the table is removed since it simply names the columns and these names are not meaningful for our example. The four columns are then converted into integer numerical values.
Since each table entry contains two values, we define a graphical box for which the width and the height are directly mapped to the first and second value, respectively. A popup is then defined that gives more details about the table entry. This is followed by labeling each element with the first numerical entry value, the identifier.
Lastly, edges are built, linking each entry to its parent, and all elements are laid out as a horizontal tree. Note that we assume here that (i) entries are ordered in the table according to their identifier and (ii) the parent of the first entry is the entry itself.
A graphical element acts as a visual facade for the object that the element represents, i.e. models provided using elementOn: or elementsOn:. Roassal transparently associates each element to this model object. Typically these objects are externally provided. For example, in the example with the small table given above, each Roassal element represents an entry from the table. Each element has a particular size that is computed from the table entry.
The visual representation given by an element's shapes and the interactions offered to the end user depends on the model object. In Figure 2.1, all the elements have the same shape: a RTBox object with two functions used to compute the width and the height of an element. These functions are evaluated against the table entry given as a parameter when the element is created, using elementsOn:.
3. Shapes
In Roassal, several primitive shapes are offered, both for individual elements and for edges.
3.1. Element shapes
Six shapes are meant to cover most typical usages:
-
RTBox: a rectangular box, e.g.,RTBox new width: 10; height: 20 -
RTEllipse: an ellipse, e.g.,RTEllipse new width: 10; height: 20 -
RTLabel: a textual label, e.g.,RTLabel new text: 'hello world'. The text may be multi-lined. -
RTPolygon: a polygon, e.g.,RTPolygon new vertices: { 25 @ 0 . 10 @ 50 . 50 @ 20 } -
RTBitmap: an image., e.g.,RTBitmap new form: RTIcon roassal -
RTSVGPath: an SVG path, e.g.,RTSVGPath new path: 'M150 0 L75 200 L225 200 Z' -
RTArc: arc portion, e.g.,RTArc new externalRadius: 100;innerRadius: 20; outerAngle: 45 innerAngle: 90
For each of the examples above, filling in the ... in the following code template produces an executable code snippet:
	v := RTView new.
	shape := ... .
	v add: shape element.
	v
An element shape understands the following messages, amongst others:
-
size:sets both width and height to the provided argument -
width:andheight:set the width and the height, respectively -
color:sets the fill color of the shape -
borderColor:sets the border color of the shape
The complete set of messages that may be used with element shapes is declared in the classes RTShape and RTAbstractElementShape. As already mentioned, these methods may accept numerical values, or block functions. In case a block is provided, it has to return a numerical value when evaluated against the object model.
3.2. Edge shapes
Edges are typically drawn between two elements. Similar to elements, an edge may have a shape.
-
RTLine: a straight line between its extremities, e.g.,RTLine new color: Color blue -
RTArrowedLine: an arrowed line between its extremities, e.g.,RTArrowedLine new color: Color blue -
RTDirectedLine: a directed line, e.g.,RTDirectedLine new. The directed line is a kind of Bezier line for which the curve indicates the direction. -
RTMultiLine: segmented lines, e.g.,RTMultiLine new orthoVertical; color: Color blue
The following template shows the use of edge shapes. As previously, simply replace the missing part with the shape variable by an expression example given above.
	v := RTView new.

	elementShape := RTEllipse new size: 20; color: Color blue trans.
	e1 := elementShape elementOn: 'Start'.
	e2 := elementShape elementOn: 'End'.
	v add: e1.
	v add: e2.
	e1 @ RTDraggable.
	e2 @ RTDraggable.
	e1 @ RTLabeled.
	e2 @ RTLabeled.
	e2 translateTo: 50 @ 100.

	shape := ... .
	v add: (shape edgeFrom: e1 to: e2).
	v
The expression e1 @ RTDraggable makes the element e1 draggable using the mouse. The expression e1 @ RTLabeled adds a label above the element e1. This label reflects the object model of e1, the string object 'Start' in our case.
3.3. Shape composition
In some cases, primitive graphical elements are simply not enough. One tipical scenario is labeling, often achieved by combining a label and a graphical element. Roassal offers a simple and expressive mechanism to compose shapes in order to produce more elaborated ones (such as a labeled rectangle) Consider the following example (Figure 3.1):
	v := RTView new.

	s := (RTBox new size: 30) + RTLabel.
	es := s elementsOn: (1 to: 20).
	v addAll: es.
	RTGridLayout on: es.
	v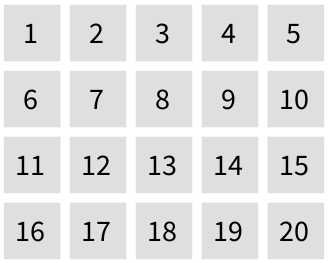
A shape may receive the message + to be composed with another shape. The expression (RTBox new size: 30) + RTLabel produces a new shape, a 30-pixeled-size box with a label in it. The value of the label is provided by the model object behind the associated element: a numerical value, ranging from 1 to 20, in our case.
The method + is defined on the class RTShape a:
	RTShape >> + anotherShape
		^ RTCompositeShape with: self with: anotherShape instance
Underneath, the class RTCompositeShape is used for composition. The expression (RTBox new size: 30) + RTLabel has therefore the same effect than RTCompositeShape with: (RTBox new size: 30) with: RTLabel new.
The class RTCompositeShape provides a number of useful methods to structure the composite shapes. For example, in case you wish to have the label below the box and have a different size for each box, you can use the following (Figure 3.2):
	v := RTView new.

	s := RTCompositeShape with: (RTBox new size: #yourself) with: RTLabel new.
	s vertical.
	es := s elementsOn: (10 to: 100 by: 5).
	v addAll: es.
	RTFlowLayout on: es.
	v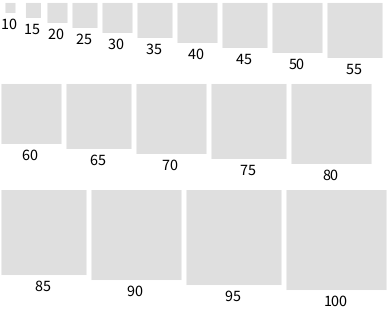
The script above creates a composite shape made of two shapes: a box and a label.
The use of the vertical message sent to this composite shape makes the first subshape (i.e., the box) above the second subshape (i.e., the label).
Composed shapes are often employed to give a title to elements. The following example visualizes some of the classes defined in Roassal (Figure 3.3):
	v := RTView new.
	shape := RTCompositeShape new.
	shape add: (RTLabel new color: Color gray).
	shape add: (RTBox new
			color: Color lightRed;
			width: [ :cls | cls numberOfVariables * 8 ];
			height: #numberOfMethods).
	shape vertical.
	es := shape elementsOn: RTShape withAllSubclasses.

	v addAll: es.
	RTGridLayout on: es.
	v
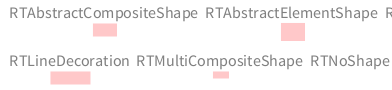
The expression RTShape withAllSubclasses returns a collection of Pharo classes describing some Roassal shapes: the script above visualizes the Roassal application in Roassal itself!
Each class is represented as a composite shape. A title is first added to the composite shape. Then a box is added, its width represents the number of variables and the height represents the number of methods defined in each class.
We have previously seen that the interaction RTLabeled can be used to give a label to an element. The natural question is how does RTLabeled differ from using a composite shape? The answer is that using RTLabeled add a label to the view, and makes it stick to the element. The size of the element is defined by the shape it originates from. This matters when doing a layout. Consider the following example (Figure 3.4):
	v := RTView new.
	shape := RTBox new
			color: Color lightRed;
			width: [ :cls | cls numberOfVariables * 8 ];
			height: #numberOfMethods.
	es := shape elementsOn: RTShape withAllSubclasses.

	v addAll: es.
	es @ RTLabeled.
	RTGridLayout on: es.
	v
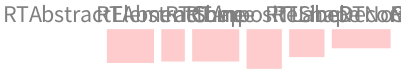
RTLabeled
This example is similar to the composite shape example given previously. Instead of using a composite shape, the interaction RTLabeled is used. The result is immediately visible: the labels overlap when doing a layout. Note that this behavior may be wished in some case. An interesting configuration option on RTLabeled is setAsHighlightable. Consider this slightly improved version (Figure 3.5):
	v := RTView new.
	shape := RTBox new
			color: Color lightRed;
			width: [ :cls | cls numberOfVariables * 8 ];
			height: #numberOfMethods.
	es := shape elementsOn: RTShape withAllSubclasses.

	v addAll: es.
	es @ (RTLabeled new setAsHighlightable) .
	RTGridLayout on: es.
	v
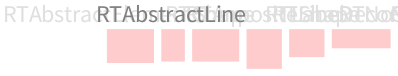
RTLabeled and highlight
The interaction we use is RTLabeled new setAsHighlightable: when the mouse goes above an element, the label is highlighted, thus making it readable.
Composite shapes may have a layout to order the inner shapes. Consider the following example:
	s := RTCompositeShape new.
	b1 := RTBox new color: Color green.
	b2 := RTBox new color: Color blue; size: 20.
	b3 := RTLabel new.
	s add: b1.
	s add: b2.
	s add: b3.
	s horizontal.
	s setAutomaticRelayout.

	e := s elementOn: 'click to expand'.
	view := RTView new.
	view add: e.

	e @ RTDraggable.
	e @ RTPopup.

	e when: TRMouseClick do: [ :ev |
		e trachelShape shapes second extent: 45 @ 45.
		e trachelShape shapes third text: 'hello'.
		view signalUpdate.
	].

	view open
Clicking on the element resizes the second and third inner shapes. Since the automatic relayout has been set using #setAutomaticRelayout, shapes will be properly ordered.
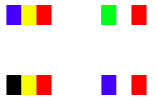
Shapes may also be translated within a composite shape. Consider the following example that paints four national European flags (Figure 3.6):
	view := RTView new.
	shape := RTCompositeShape new.
	shape add: (RTBox new color: #first; height: 20; width: 15).
	shape add: (RTBox new color: #second; height: 20; width: 15) translateBy: 15 @ 0.
	shape add: (RTBox new color: #third; height: 20; width: 15) translateBy: 30 @ 0.

	flags := Dictionary new.
	flags at: 'France' put: (Array with: Color blue with: Color white with: Color red).
	flags at: 'Belgium' put: (Array with: Color black with: Color yellow with: Color red).
	flags at: 'Romania' put: (Array with: Color blue with: Color yellow with: Color red).
	flags at: 'Italia' put: (Array with: Color green with: Color white with: Color red).

	els := shape elementsOn: flags values.
	view addAll: els.

	RTGridLayout new on: els.
	view
4. Element transformation
An element may be translated in the view using the translateBy: and translateTo: messages, both taking a point as argument.
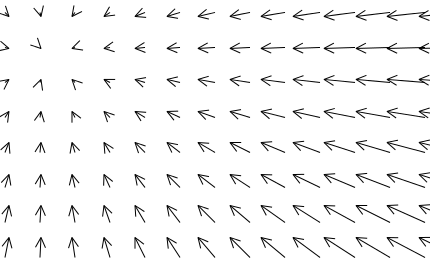
Elements may be rotated by sending rotateByDegrees:. This message accepts as argument a numerical value (e.g., rotateByDegrees: 30), a symbol or a block, as in the following example (Figure 4.1):
	v := RTView new.
	shape := RTBox new width: 5; height: 25.
	es := shape elementsOn: (1 to: 90 by: 5).
	es rotateByDegrees: #yourself.
	RTHorizontalLineLayout new gapSize: 2; on: es.
	v addAll: es.
	v

In total, 18 elements are added in the view. Each element represents a value between 1 and 90, with an interval of 5. The variable es represents a group of elements. By sending the message rotateByDegrees: to a group, each element of the group is rotated as specified in the argument of the message.
5. Group of elements
The class RTGroup is an ordered collection to contain elements. A group is a composite of elements and dispatches each received messages to each contained element received messages. A group may be resized, rotated, and scaled.
Groups are used to uniformly manipulate a set of elements. In the example given above, the expression shape elementsOn: (1 to: 90 by: 5) returns a group, to which the message rotateByDegrees: #yourself is sent. Note that a group may also contain another group.
6. Nesting elements
Expressing containment is critical as soon as the data to be represented is hierarchical. Being able to embed elements into other elements is a natural way to express encapsulation. Roassal offers several options to express nesting or encapsulation, all rooted in the class RTNest.
The message on: element nest: someElements is probably the most commonly used. This message nests someElements into element. Consider the following example (Figure 6.1):
	v := RTView new.
	el := (RTBox new width: 80; height: 40; color: (Color purple alpha: 0.3)) element.
	shape := RTBox new color: (Color red alpha: 0.3); size: #yourself.

	innerElements := (1 to: 30) collect: [ :i | shape elementOn: i ].
	v addAll: innerElements.

	RTGridLayout new on: innerElements.
	RTNest new
		on: el nest: innerElements.
	v add: el.
	v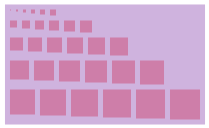
The message on:nest: takes as the first argument an element, onto which you wish to nest a group of elements provided as second argument. The nesting element (i.e., the first argument provided to on:nest:, el in our example) is resized to encapsulate the nested elements. Dragging an encapsulating element also drag its child elements.
The precedent example first sets the layout for the inner elements, then nests the elements (RTGridLayout on: inner. RTNest new on: el nest: inner).
A layout may be specified when using RTNest. This may be written as follows:
	RTNest new
		layout: RTGridLayout new;
		on: el nest: innerElements.
The message for:add: is useful for iterating over a group of elements and defines nested elements for each element of a set. Consider the example (Figure 6.2):
	v := RTView new.
	es := (RTBox new color: Color blue trans)
			elementsOn: (1 to: 20).
	v addAll: es.

	RTNest new for: es add: [ :group :model |
		group addAll: ((RTBox new color: Color red) elementsOn: (1 to: model)).
		RTGridLayout on: group ].

	RTGridLayout on: es.
	v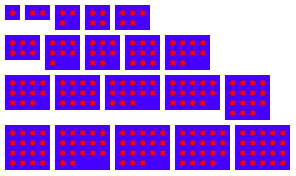
for:add: to nest elements
The message for:add: takes as first argument the group of elements to iterate over. The second argument is a block that follows the pattern [ :group :model | ... ]. The variable group is a group in which elements to be nested have to be added. The variable model is the model represented by the nesting node. The model is often essential to build the elements that have to be nested.
As a further example, consider the following script:
	v := RTView new.
	es := (RTBox new color: Color white; borderColor: Color lightGray)
		elementsOn: { RTLayout . RTShape . RTBuilder }.
	v addAll: es.
	es @ RTDraggable.

	RTNest new for: es add: [ :group :model |
		elements := (RTBox new color: Color red) elementsOn: model withAllSubclasses.
		group addAll: elements.
		edges := RTEdgeBuilder new
			view: group;
			objects: model withAllSubclasses;
			connectFrom: #superclass.
		RTTreeLayout on: elements edges: edges .
	].

	RTGridLayout on: es.
	v
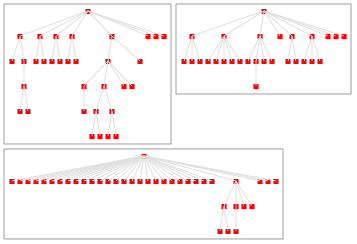
Figure 6.3 illustrates the usage of for:add: in which edges are added in the group.
7. Interaction to empower elements
In Roassal, an interaction is modeled as a particular object that augments a Roassal element with appropriate answers to user event. A large range of user events are supported: mouse click, move movement and key strokes are probably the most common user events. Interaction may be set to a view, elements or edges.
Three interactions may be set to a view:
-
RTDraggableViewto set a view draggable. E.g.,view @ RTDraggableView. -
RTHorizontalDraggableViewto make a view horizontally draggable. -
RTVerticalDraggableViewto make a view vertically draggable. -
RTDoubleScrollBarto add scrollbars in a view.
A number of interactions are available for elements:
-
RTDraggablemakes an element draggable. A user can then use the mouse to drag and drop the element. -
RTDraggableChildrenmakes an element draggable. When being dragged, connected elements with an edge are also dragged. Consider the following example that usesRTDraggableViewandRTDraggableChildren(Figure 7.1 has been obtained by dragging the number 5):
	v := RTView new.
	v @ RTDraggableView.

	es := RTLabel elementsOn: (1 to: 40).
	v addAll: es.
	RTEdgeBuilder new
		view: v;
		elements: es;
		connectFrom: [ :aValue | aValue // 2 ].
	RTClusterLayout on: es.
	es @ RTDraggableChildren.
	v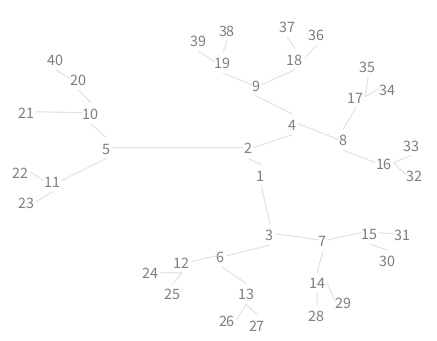
-
RTPopupdynamically adds a text to the element pointed by the mouse. -
RTLabeledadds a label above an element. The label may be particularized usingtext:if the default string representation is not sufficient. Consider:
	v := RTView new.
	e := (RTEllipse new size: 30) elementOn: 42.
	v add: e.
	e @ (RTLabeled new text: [ :value | 'My value is ', value asString ]).
	v
-
RTShowLabeladds a label on a set of elements when the mouse enters a particular element.RTLabeledis used for the labeling. When the mouse leaves the element, all the labels are removed. -
RTShowEdgeadds edges on one particular element when the mouse is above the element. Edges are removed when the mouse leaves the element. -
RTSetEdgeAlphatemporarily decreases the transparency of the incoming and outgoing edges for a given element when the mouse enters the element. When added to an element, connected edges are made transparent. -
RTResizeableenables to resize en element by the user. Consider the following example:
	v := RTView new.

	s := RTBox new color: Color blue; size: 20.
	e := s element.

	e @ RTResizable.
	v add: e.
	v
Event may be propagated to other elements using RTEventForwarder. This is handy in case objects have to forward some particular actions. Consider the following example
	v := RTView new.

	box1 := (RTBox new size: 20) element.
	box2 := (RTBox new size: 20) elementOn: 'hello'.

	box2 translateBy: 50 @ 0.
	box2 @ RTDraggable.

	box1 @ RTDraggable.
	box1 @ (RTEventForwarder new toObject: box2).

	v add: box1.
	v add: box2.
vRTEventForwarder is in case elements are above other elements. Consider the following example:
	v := RTView new.

	inner := (RTBox new color: Color green; size: 30) elementOn: 'world'.
	outer := (RTBox new color: Color blue) elementOn: 'hello'.

	inner @ (RTHighlightable new highlightedColor: Color yellow).
	outer @ RTPopup.
	inner @ (RTEventForwarder new toObject: outer).

	v add: outer ; add: inner.
	RTNest new on: outer nest: { inner }.
	v
The element inner, located above outer, had an interaction RTHighlightable. Without this interaction, locating the mouse above inner displays the popup for outer. However, since inner has an interaction already, the elements answer events RTMouseLeave and RTMouseEnter. The runtime does not search for elements answering these events which may be located below it. RTEventForwarder is here used to make inner answer the highlighting interaction and triggering the popup of outer.
8. Composite shapes vs RTLabeled
We introduced the notion to compose shapes as an effective way to label elements. Why do we then need the interaction RTLabeled if one can simply write RTBox + RTLabel? For example, the following example (Figure 8.1):
	v := RTView new.

	cShape := RTCompositeShape new.
	cShape add: (RTLabel new text: [ :aValue | 'Value = ', aValue asString ]).
	cShape add: (RTBox new size: 30).
	cShape vertical.

	es := cShape elementsOn: (1 to: 20).
	es @ RTDraggable.
	v addAll: es.
	RTGridLayout on: es.
	v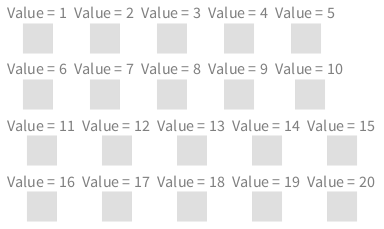
The code above creates a composite shape with two shapes, a label and a box. Elements are then built from the composite shape.
Using the RTLabeled interaction, a similar code may be (Figure 8.2):
	v := RTView new.

	s := (RTBox new size: 30).
	es := s elementsOn: (1 to: 20).
	es @ RTDraggable.
	v addAll: es.

	es @ (RTLabeled above text: [ :aValue | 'Value = ', aValue asString ]).
	RTGridLayout on: es.
	v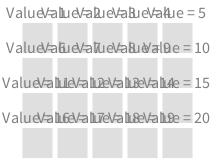
RTLabeled
After having created elements, a label is added to the elements.
There is a number of differences between using a composite shapes and using RTLabeled:
- The label added with
RTLabeledis not taken into account when computing the encompassing boundary of the element. As a result, the layout does not take the label into account, which may result in overlapping labels, as Figure 8.2 illustrates. There is no general rule on whether the label has to be taken into account when layouting. It all depends on the purpose of the visualization. -
RTLabeledmay be selectively applied to some elements, while with a composite shape, all the elements produced by the shape have a label.
9. Normalization
Being able to quickly compare data elements is essential in a visualization. Pre-attentive processing refers to the ability of the human brain to unconsciously accumulate information from the surroundings. Without even realizing what is in front of our eyes, the brain filters and processes what is important. This phenomena is particular relevant in data visualization. Our brain is able to immediately spot an element that is different shaped or colored.
The class RTMetricNormalizer normalizes one or more visual dimensions of a set of Roassal elements. Consider the following example (Figure 9.1):
	v := RTView new.
	es := (RTEllipse new color: Color blue) elementsOn: #(4 5 1 2 3 5).
	v addAll: es.

	es @ RTPopup.

	RTMetricNormalizer new
		elements: es;
		alphaColor;
		normalizeSize: #yourself.

	RTHorizontalLineLayout new alignCenter; on: es.

	es @ RTLabeled.

	v
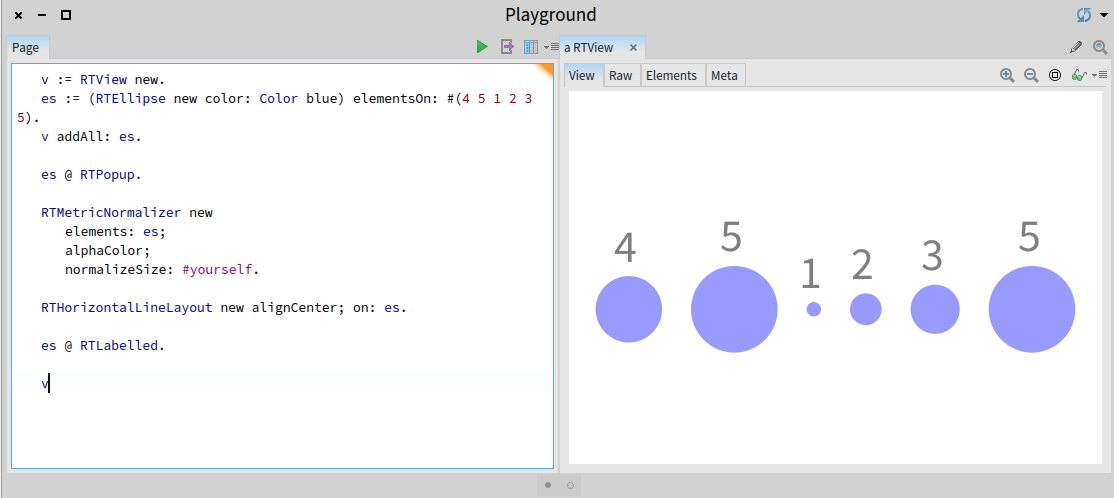
The script above creates six elements, each representing one of the values in #(4 5 1 2 3 5). Elements are then added to the view and a popup interaction is given to each element.
The class RTMetricNormalizer is then instantiated. Elements to be normalized are set in the metric normalizer using elements:. Elements are first made translucent (note that strictly speaking the message alphaColor is not a normalization, but rather a convenience). The message normalizeSize: normalizes the size of each element against the set of elements provided with elements:. The default minimum size is 5 pixels and the maximum is 30 pixels. Such values may be specified using normalizeSize:min:max:. For example:
	v := RTView new.
	es := (RTEllipse new color: Color blue) elementsOn: #(4 5 1 2 3 5).
	v addAll: es.

	es @ RTPopup.

	RTMetricNormalizer new
		elements: es;
		alphaColor;
		normalizeSize: #yourself min: 20 max: 50;
		normalizeColor: #yourself.

	RTHorizontalLineLayout new alignCenter; on: es.

	es @ RTLabeled.
	v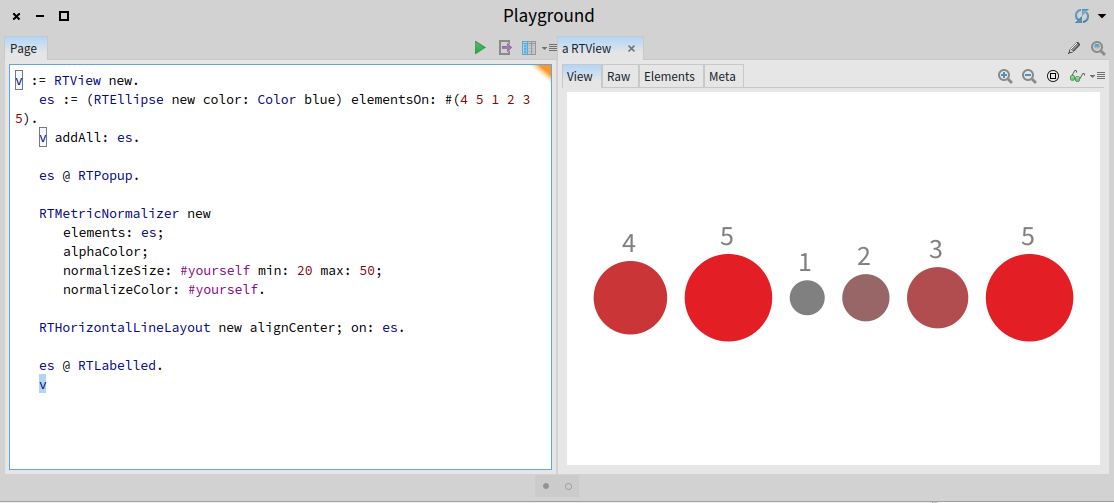
The example given above normalizes both the size and the color of the elements. The color palette is continuous, ranging from gray to red. Colors may be provided using normalizeColor:using:, as in the instruction normalizeColor: #yourself using: { Color gray . Color orange . Color black }.
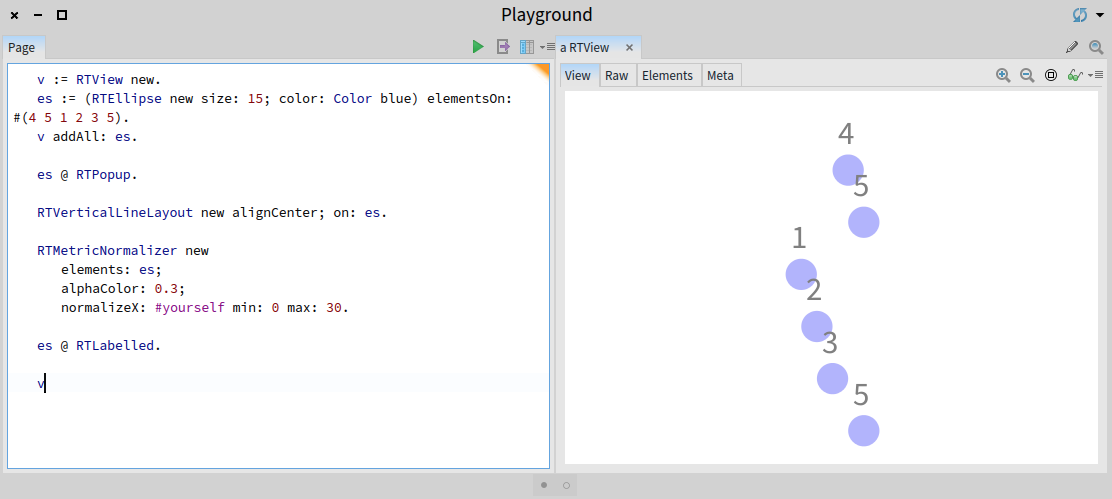
Similarly, the position along the X-axis may be normalized. Consider the example below (Figure 9.3):
	v := RTView new.
	es := (RTEllipse new size: 15; color: Color blue) elementsOn: #(4 5 1 2 3 5).
	v addAll: es.

	es @ RTPopup.

	RTVerticalLineLayout new alignCenter; on: es.

	RTMetricNormalizer new
		elements: es;
		alphaColor: 0.3;
		normalizeX: #yourself min: 0 max: 30.

	es @ RTLabeled.

	v
Normalization is essential for rendering curve and graph. Consider the script:
	v := RTView new.
	es := (RTBox new size: 15; color: Color blue) elementsOn: #(4 5 1 2 3 5).
	v addAll: es.

	es @ RTPopup.

	RTMetricNormalizer new
		elements: es;
		alphaColor: 0.3;
		normalizeHeight: #yourself min: 0 max: 80.

	RTHorizontalLineLayout new alignBottom; on: es.

	es @ RTLabeled.

	v
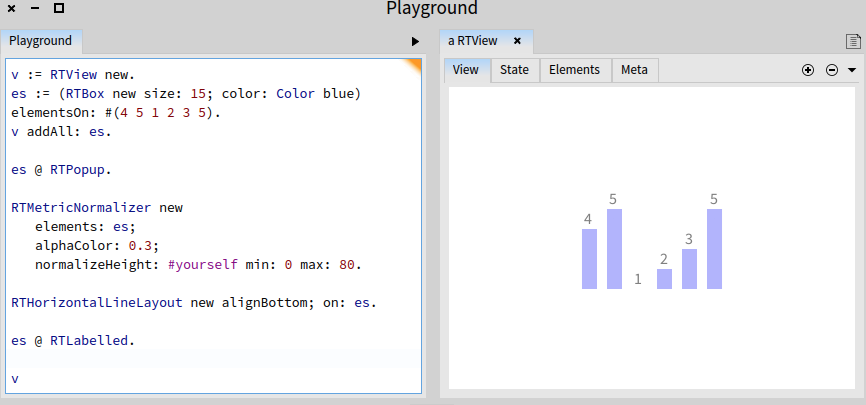
You can notice this histogram is not quite right. The bar for the element 1 is not visible. This is because it has a height of 0. This is expected since the minimum value of the elements model is 0 pixel (i.e., the value provided to min:). A proper version of our (primitive) bar charting needs to specify a minimum and maximum value. Consider (Figure 9.5):
	v := RTView new.
	es := (RTBox new size: 15; color: Color blue) elementsOn: #(4 5 1 2 3 5).
	v addAll: es.

	es @ RTPopup.

	RTMetricNormalizer new
		elements: es;
		alphaColor: 0.3;
		normalizeHeight: #yourself min: 0 max: 80 minValue: 0 maxValue: 5 .

	RTHorizontalLineLayout new alignBottom; on: es.

	es @ RTLabeled.

	v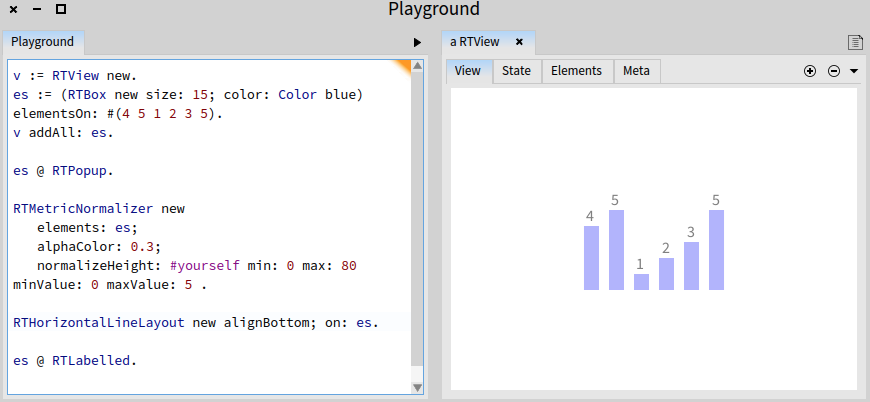
The message normalizeHeight:min:max:minValue:maxValue: takes as argument a minimum and maximum value.
The normalizer may also give a color to each element based on a particular attribute. Consider the following example (Figure 9.6):
	v := RTView new.
	es := RTBox elementsOn: Collection withAllSubclasses.
	v addAll: es.
	n := RTMetricNormalizer new
			elements: es;
			normalizeHeight: #numberOfMethods;
			normalizeWidth: #numberOfVariables;
			distinctColorUsing: #package.
	RTHorizontalFlowLayout on: es.
	v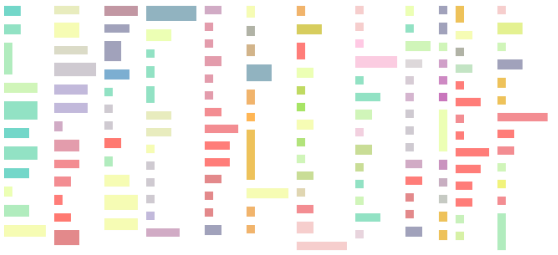
The script above creates a boxed element for each subclasses of the class Collection. These elements are then added in a view. The normalizer computes the height using the number of methods, the width using the number of variables, and gives a color to each class based on the package the class belongs to.
10. Expressing constraints
A constraint is a relation between two or more elements about their position.
10.1. Alignment
Adequately positioning some elements against other elements is often crucial.
It frequently happens that an element has to be resized or positioned against other elements or even the window. The class RTAlignment offers a number of methods dedicated to constrain the size or the position of some elements.
Consider the following example (Figure 10.1):
	values := #(35 26 5 18 17 60 36 13 16 28 29 3 8 0 3 2 14
				12 13 17 1 9 3 3 4 1 1 1 2 1 1 61).
	v := RTView new.
	n := RTMultiLinearColorForIdentity new objects: values.
	shape := RTBox new color: n; size: #yourself.
	es := shape elementsOn: values.
	v addAll: es.
	RTHorizontalLineLayout new gapSize: 0; on: es.
	RTAlignment new elements: es; top.
	v
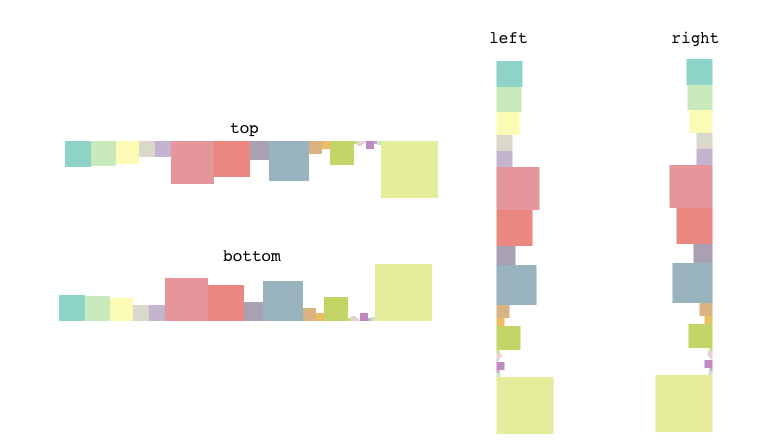
Figure 10.1 illustrates the different ways to line up elements using the class RTAlignment. Elements can be lined up with their lowest point (bottom), with the left-most position (left),
and with the right-most position using right. You may want to replace RTHorizontalLineLayout by RTVerticalLineLayout to try left and right in the script given above.
Alignment may also be defined using a particular element. You simply need to set that element using fixedElement:. You can then use the messages top, left, right, bottom.
The class RTGroup is polymorphic to RTElement, which means that you can provide a group of elements where an element is expected. Consider the following example (Figure 10.2):
	rootClasses := { RTShape . RTLayout }.

	groups := rootClasses collect: [ :cls |
		g := RTGroup new.
		elements := (RTEllipse new size: 8; color: Color blue)
			elementsOn: cls withAllSubclasses.
		g addAll: elements.
		edges := RTEdgeBuilder new
			view: g;
			objects: cls withAllSubclasses ;
			connectFrom: #superclass.
		RTTreeLayout on: elements edges: edges.
		g ].

	v := RTView new.
	groups do: [ :aGroup | v addAll: aGroup ].
	RTHorizontalLineLayout new gapSize: 30; on: groups.

	RTAlignment new elements: groups; bottom.
	v
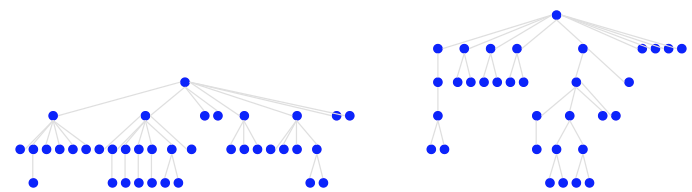
groups contains a collection of RTGroup, each contains elements corresponding to all the subclasses of a particular class.
The message elements:, sent to the object RTAlignment, takes as argument the groups variable.
10.2. Positioning
The class RTConstraint offers a number of methods to position elements against other elements. A constraint has to be properly initialized using fix: to set those that are fixed elements and movable: to set the elements that have to be moved and/or constrained.
	v := RTView new.

	e := (RTBox new size: 50) element.
	e @ RTDraggable.
	v add: e.

	l := RTLabel elementOn: 'This is a label!'.
	v add: l.

	RTConstraint new
		movable: l;
		fix: e;
		inner;
		bottom;
		move.
	v
The code above simply moves the label at the bottom of the square, while being in the inner side. You may experiment by replacing:
-
innerbyouterorborder, to have the movable element on the outer or border side of the fixed element. -
bottombyright,top,left. Note that position may be combined withleft; topfor example. -
movebystickto make the label stick to the square when dragged and dropped.
The move operation moves the movable element according to the fixed element. Using the mouse to drag the box does not move the label. To do so, you need to use the stick operation.
The example given above uses a single element for fix: and movable:. Groups may be provided instead to handle a set of elements. Consider the following example (Figure 10.3):
	v := RTView new.
	n := RTMultiLinearColorForIdentity new
				numberOfColors: 20;
				colors: { Color red . Color gray }.
	es1 := (RTEllipse new color: n; size: 15) elementsOn: (1 to: 20).
	v addAll: es1.

	n := RTMultiLinearColorForIdentity new
				numberOfColors: 20;
				colors: { Color yellow . Color purple }.
	es2 := (RTEllipse new color: n; size: 15) elementsOn: (1 to: 20).
	v addAll: es2.

	RTForceBasedLayout on: es1.
	RTGridLayout on: es2.
	RTConstraint new movable: es1; fix: es2; above; move.
	v
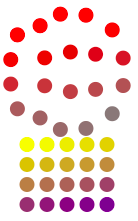
Two groups of elements are used in this example, es1 and es2. A force based layout is applied to the first group while a grid layout is applied to the second group. The use of RTConstraint positions the first group above the second group.
11. Shape and Edge builder
Roassal offers a rich class library to define elements and edge shapes. These shapes cover typical uses of Roassal. Roassal shapes are modeled with the hierarchy rooted in RTShape. Directly Manipulating shapes is often tedious. Instead, Roassal offers the shape and edge builder.
11.1. Element shapes
Consider the following example (Figure 11.1):
	v := RTView new.
	sb := RTShapeBuilder new box
		height: #numberOfMethods;
		width: [ :cls | cls numberOfVariables * 4 ];
		withTextAbove.
	es := sb elementsOn: RTShape withAllSubclasses.
	v addAll: es.
	RTFlowLayout on: es.
	v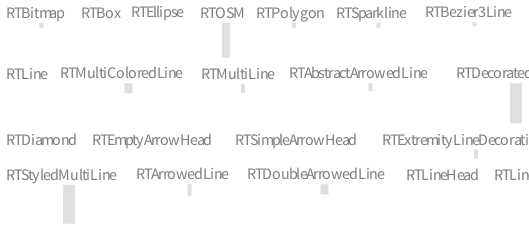
A shape builder is first created. It is then configured as a box (note that box is synonym to rectangle). A height: and a width: is then provided to set the height and the width of the boxes that will be produced later on.
The message withTextAbove sets the shape builder to give a label to the boxes. A number of methods exist:
-
withTextaugments the shape with a label, located at the center of it -
withTextAbovedefines the shape with a text above -
withTextBelowmakes the text located below.
A block may be provided to these methods to compute the text to be used (withText:, withTextAbove:, withTextBelow). This example shows the benefits of using the shape builder: there is no need to explicitly use composed shapes. The builder does it for us.
11.2. Edge shapes
The edge builder create connections between elements and it is an important asset for Roassal. The expressiveness of the Edge Builder is based on a semi-declarative relation. Consider the following example (Figure 11.2):
	v := RTView new.
	shape := (RTEllipse new size: 20; color: Color red trans) + RTLabel.
	es := shape elementsOn: (1 to: 20).
	v addAll: es.

	eb := RTEdgeBuilder new.
	eb view: v.
	eb shape orthoVerticalLine.
	eb
		objects: (1 to: 20);
		connectFrom: [ :n | n // 3 ].

	v elements @ RTDraggable @ RTPopup.

	RTTreeLayout on: v elements.
	v
An edge builder is obtained by first instantiating the class RTEdgeBuilder. The view has to be provided since the purpose of the edge builder is to build edges, which have to be added in a view. An edge builder offers a shape builder to let the user define line shapes. The shape builder used by the edge builder is obtained by sending the message #shape to the builder. In the example above, we simply select orthogonal vertical lines using the message #orthoVerticalLine.
Some objects may be specified to the edge builder. These objects define the scope of how to build edges. The message #objects: sets the objects from which the edges are starting and ending. In the example above, an edge is built from each object ranging from 1 to 20.
The message #connectFrom: takes a bloc as parameter. In the example the bloc is [ :n | n // 3 ]. The bloc accepts one argument and is evaluated for each object. Evaluating the bloc returns a new number to which the edges will be connected.
The class RTEdgeBuilder contains numerous methods that offers a great flexibility on building edges. We advice you to browse the class to have the complete list of methods. Methods that are common used are:
-
connectFrom:builds an edge from the result of the bloc to the current object. -
connectFrom:to:allows you to specify the ending object in addition to the starting object. -
connectToAll:creates many lines: the argument bloc returns a list of objects to which edges have to be build. Many edges can therefore be built for one single object.
The chapter on Mondrian provides several examples using the edge builder.
12. Dynamically update
Updating a visualization may considerably improve the user experience. Roassal offers a number of facilities to add, update, and remove elements.
12.1. Updating edges
As soon as an element is moved (using translateBy: or translateTo:), edges connected to it are updated. Consider the following example (Figure 12.1):
	v := RTView new.
	es := RTBox elementsOn: (1 to: 300).
	RTGridLayout new gapSize: 30; on: es.

	edges := OrderedCollection new.
	es do: [ :e |
		| te |
		te := RTBox element.
		te translateTo: e position + (0 @ 10).
		edges add: ((RTArrowedLine new color: Color black) edgeFrom: e to: te).
	].

	v addAll: edges.

	v when: TRMouseMove do: [ :evt |
		edges do: [ :edge |
			edge to
				translateTo: (evt positionFromCamera - edge from position) / 10 + edge from position.
		].
		v signalUpdate.
	].
	v
All the arrowed edges points towards the mouse cursor. The variable edges is initialized with an empty collection. This collection is filled with edges obtained from an arrowed line. Note that the elements contained in es and e are not added in the view; only the edges are.
A callback is set to the view when the mouse cursor is moved: the to extremity of the edge is translated accordingly. The message positionFromCamera is used to get the mouse cursor position in the space coordinate.
12.2. Dynamically adding elements
Elements may be easily added and removed. Consider the following example (Figure 12.2):
	v := RTView new.
	v @ RTDraggableView.

	"We set a dynamic spring layout"
	stepping := RTSpringLayoutStepping new view: v.
	stepping after: [ v canvas camera focusOnCenter ].
	v addAnimation: stepping.

	"Add a new circle when pressing on a button"
	v canvas addMenu: 'Add circle' callback: [
		| el |
		el := (RTEllipse new size: 20; color: (Color blue alpha: 0.4)) element.
		el @ RTDraggable.
		el translateTo: 5 atRandom @ 5 atRandom.
		v add: el.
		stepping addNode: el.
		v signalUpdate.
	].

	"Add a new edge when pressing on a button"
	v canvas addMenu: 'Add connected circle' callback: [
		| el edge |
		el := (RTEllipse new size: 20; color: (Color blue alpha: 0.4)) element.
		el @ RTDraggable.
		el translateTo: 5 atRandom @ 5 atRandom.
		v add: el.

		edge := RTLine edgeFrom: el to: v elements atRandom.
		v add: edge.

		stepping addNode: el; addEdge: edge.
		v signalUpdate.
	].
	v
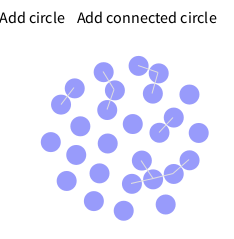
The Trachel canvas offers facilities to add menu to the canvas. We use the message addMenu:callback: to let the user to add nodes and edges. Most of the script given above deals with the dynamic spring layout: adding an element or an edge needs to update the layout.
13. Roassal visualization in a web browser
Roassal may export a visualization toward several file formats, including PNG, SVG, HTML5. Exporting a visualization to HTML5 produces two files, the HTML file and a file called roassal.js. The visualization is encoded in JavaScript and makes use of the roassal.js JavaScript library. Some interactions are preserved when being exported, in particular drag-and-drop and popup.
14. Debugging a visualization
Debugging a visualization may be complicated in some situations. In case an anomaly occurs during the construction of the view content, then an error will popup a Pharo debugger. In case the view triggers an error during the rendering of it, situations become more complicated due to the complexity of low level graphical primitive and multi-threading. In case you get a red area, you can render the view in a mock canvas. This can be done using:
	v := RTView new.
	es := RTBox elementsOn: (1 to: 10).
	v addAll: es.
	RTGridLayout on: es.
	v canvas buildMorph drawOnMockCanvas
You need to execute using the do-it menu option.