Documenting with a Legend
A legend is essential as soon as non-trivial data is visualized. Unless a visualization is frequently used or highly intuitive, a legend is necessary to guide the user with all the different visual cues. RTLegendBuilder is the main class to build legends. It offers facilities that are both easy to use and flexible enough to accomodate most of the need.
A legend is created with the following steps:
- Create an instance of the class
RTLegendBuilder - A view has to be provided to the legend builder. The legend will be added to that view.
- The legend is defined using the multiple utility functions (e.g.,
addText:,addColor:text:) - A position may be optionally provided (e.g.,
below,above,onDemand). - The message
buildhas to be sent to the builder
1. A first example
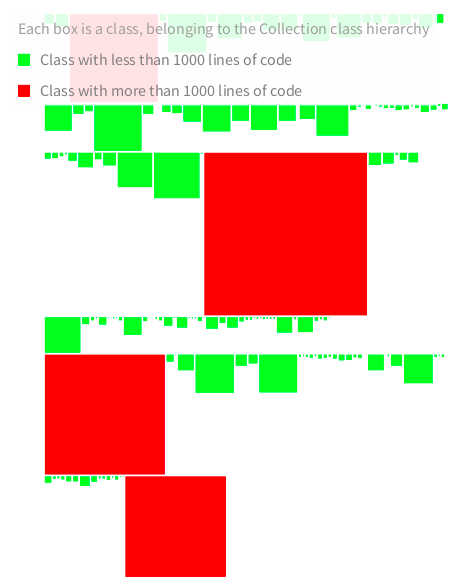
As a first example, consider the following code snippet that simply visualizes some classes. The visualization uses a color to indicate a particular threshold on the color of each class. The size of a class reflects the number of methods of the class, and if the number of lines of code of the class is below 1,000 then the class is green, otherwise it is red (Figure 1.1):
	"The view will be passed to the RTLegendBuilder"
	v := RTView new.
	es := RTBox new
		size: #numberOfMethods;
		color: [ :cls |
			cls numberOfLinesOfCode <= 1000
				ifTrue: [ Color green ]
				ifFalse: [ Color red ] ];
		elementsOn: Collection withAllSubclasses.
	v addAll: es.
	RTFlowLayout on: es.

	"We add a legend"
	lb := RTLegendBuilder new.
	lb onDemand.
	lb view: v.
	lb addText: 'Each box is a class, belonging to the Collection class hierarchy'.
	lb addColor: Color green text: 'Class with less than 1000 lines of code'.
	lb addColor: Color red text: 'Class with more than 1000 lines of code'.
	lb build.

	v
The first code given above creates a small visualization and adds a legend to it.
The legend is available on-demand, meaning that the user has to locate the mouse cursor above the ? character, located on the top-left corner of the visualization. The view, referenced by the variable v, has to be passed to the legend builder. The legend then has to be configured. The message addText: provides a descriptive text of the legend and addColor:text: is used to give a meaning to a color. The message build adds the legend in the view v.
2. Building a legend
The class RTLegendBuilder offers many utility methods to build expressive legends. In particular:
-
addText:adds a text to the legend -
addColor: aColor text: aTextprovides a textual description of a color -
addColorFadingFrom: startColor to: endColor text: textualDescriptionuseful for describing a color fading ranging fromstartColortoendColor -
addColorFadingUsing: colors text: textualDescriptiondescribes a fading based on the provided set of colors. -
addLineColor: aColor text: aTextassociates a text to a colored line -
addRectanglePolymetricWidth: widthDescription height: heightDescription box: boxDescriptionassociates a description to the height, width, and the color of a box
3. Documenting a polymetric shape
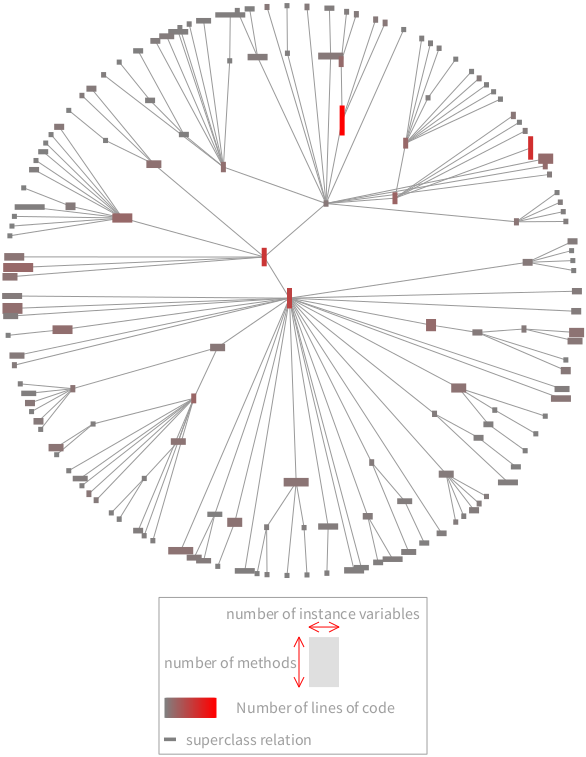
Clearly indicating the meaning of the different visual dimensions is highly important to make the visualization accessible. The following example adds a legend to a simple visualization of some classes (Figure 3.1):
	b := RTMondrian new.

	b nodes: Collection withAllSubclasses.
	b edges moveBehind; connectFrom: #superclass.
	b layout cluster.
	b normalizer
		normalizeColor: #numberOfLinesOfCode;
		normalizeWidth: [ :cls | cls numberOfInstanceVariables * 5 ];
		normalizeHeight: #numberOfMethods.
	b build.

	lb := RTLegendBuilder new.
	lb view: b view.
	lb addRectanglePolymetricWidth: 'number of instance variables' height: 'number of methods' box: ''.
	lb addColorFadingFrom: Color gray to: Color red text: 'Number of lines of code'.
	lb addLineColor: Color gray text: 'superclass relation'.
	lb build.

	b view
A description of each metric is provided using the message addRectanglePolymetricWidth:height:box: .
